
Democracy Election Cycle Infographic Diagram
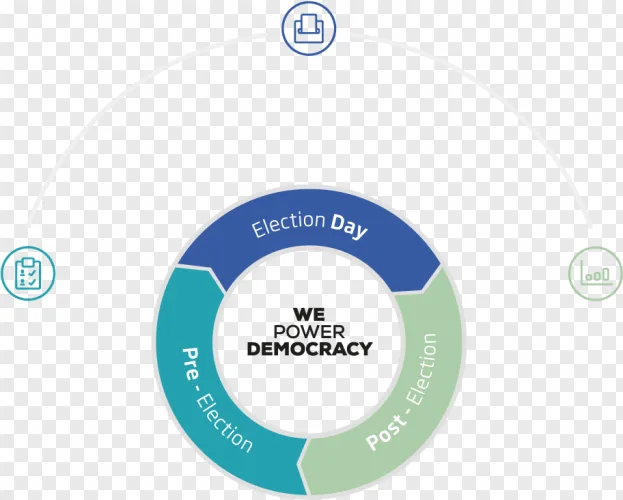
This election cycle infographic diagram illustrates the stages of the voting process from pre-election to post-election. It is ideal for political presentations, civic education materials, and democratic campaign graphics.
Free download
No login required · 100% free · Instant access
Resolution912 × 732 px
FormatPNG · transparent
File size35.2 KB
File namepngdonut-election-cycle-infographic-diagram-blue.png
LicenceUser-submitted – see terms
This image was submitted by a user. PngDonut does not own it or grant a licence for it — the rights stay with the original creator. Read the Licence terms and get permission from the rights holder before any commercial use.
Similar PNGs
More cutouts you might pair with this one.